Acoustics - Building A Sound Knowledge
We take a look at the physics behind sound
Understanding the underlying physics of sound, where it is generated and attenuated, how we measure it, and the impact it has on us, is an important part of being able to design the right air movement systems and select the correct products.
Why is sound important?
Sound is all around us, constantly – in the modern world we almost never experience complete silence. Noise has a major impact on our daily lives; it’s an important part of how we experience the world, but it can also have critical effects on our health, from sleep disturbance to impairing our ability to communicate, and more seriously damaging our hearing.
The World Health Organisation has outlined various noise levels in different environments which impact on us. For example, noise below 30dB(A) (more about how sound is measured is discussed later in this article) is unlikely to disturb sleep, noise over 40dB(A) has a detrimental effect on the quality of sleep; in industrial environments, noise above 80dB(A) is likely to cause hearing impairment.
One noise source in buildings is often the heating, ventilation and air conditioning (HVAC) system, so understanding the acoustic properties of these products is important in being able to design systems which will minimise any noise disturbance which may occur in any given environment.
Sound Pressure and Level
Let’s start by asking the fundamental question: what is sound? In our ear is a membrane called the eardrum; for us to hear a sound, the eardrum needs to vibrate, and effectively for this to happen, the air in front of the membrane needs to be moving.
For this to happen, pressure needs to build up in the ear canal. But there is always pressure at the eardrum – the static pressure is about 100,000 Pascals (the unit used to measure pressure, equivalent to the force in Newton per square metre of area).
Sound pressure differs from static pressure, because in order for there to be noise, there has to be negative pressure as well as positive pressure, to push and pull the eardrum back and forth (how quickly this happens is the frequency, which we will come onto later). Only then will we experience sound.
But when we talk about sound amplitude, we seldom talk about Pascals, and instead refer to decibels. This is because the range of sound is so large – from a few micro Pascals up to several hundred Pascals, that we prefer to use a measure which is more compact. We call this measure a level, and it uses the unit decibel (dB).
A level is essentially a comparison to a reference value. In terms of sound, that reference value is the lowest possible sound pressure which the human ear can hear, which is defined 20 micro Pascals (20µPa) which equates to 0dB. A sound stronger than this will have a positive sound pressure level, and there is a simple formula to calculate the sound pressure level in decibels, as follows:
Lp = 20 log (p / p0) = 20 log (p / 2x10⁻⁵)
where Lp is sound pressure level in decibels; p is sound pressure in Pascals; and p0 is the reference sound pressure of 20µPa
Frequency
The sound pressure level describes the amplitude of the sound, but this is only one of the two important measures of sound. The other is frequency. Frequency describes the variations of the sound pressure, which determine the character of the sound.
As we have seen, for us to hear a sound there must be a variation between positive and negative pressures; static pressure has no variations. In each cycle of pressure variation, the pressure will increase to its maximum level, decrease to its minimum level, and return to its starting point. The number of such cycles in a given time gives us the frequency of the sound.
This frequency is measured in cycles per second, or Hertz (Hz). The human ear starts to register sound at around 20 cycles per second (or Hertz); someone with full, good hearing can hear frequencies up to 20,000 Hz.
Related to frequency is wavelength. As the speed of sound is fixed, the wavelength of a lower frequency sound will be longer than that of a higher frequency sound. This gives us the formula:
c = f λ
Where c is the speed of sound in metres per second, f the frequency in Hertz, and λ the wavelength in metres.
In reality, any sound will always consist not just of one frequency, but of many, giving infinite possible sound characteristics. To enable us to describe the frequency components of a sound, we divide frequencies into groups called octave bands, allowing us to determine how much of the sound falls into each band.
Musicians will be familiar with octaves. When you hear a note, and then hear the same note an octave higher, you are in fact hearing exactly twice the frequency of the original note; so a sound at 250Hz will be the same note as a sound at 500Hz, with an octave in between. An octave band is a range between these two notes, and each band is called by the frequency which is at the geometric centre of that band.
The centre of the 44 to 88Hz band is 63, and so we call that band the 63Hz band. The eight main octave bands we deal with in HVAC systems are illustrated in Fig.1.

When we measure the sound pressure level, we can do this for each separate octave band. By specifying the sound pressure level in all bands for a particular sound, we obtain the frequency spectrum of that sound; by adding all the bands together, we gain the total sound pressure level for that sound.
How the human ear hears frequencies
While the frequency spectrum is a well-defined physical measure of a sound, it doesn’t tell us anything about how humans experience sound. Research shows that different frequencies are experienced by the human ear differently in terms of loudness – so a low frequency sound is experienced at a lower level than a high frequency sound at the same sound pressure level.
This is due to the natural attenuation and resonance of the human ear. Resonance occurs around 2 – 4kHz, the range where speech intelligibility for humans lies. The frequency response of ears varies from species to species – so the small ear of a mouse is more adapted to hear high frequency squeaks.
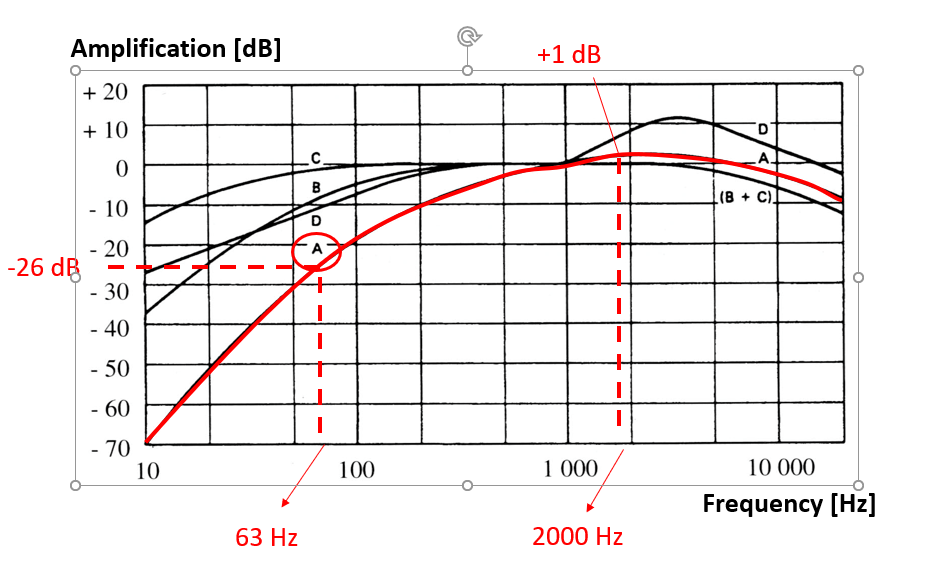
To account for this, we use a frequency weighting filter, which for humans is called A-weighting, which is shown by the red line in Fig. 1. Here we can see that the sound pressure level in the 63Hz band is reduced by 26dB and the sound pressure level in the 2,000Hz band is increased by 1dB. Therefore, human hearing is not very sensitive to low frequency sound.

To work out the total A-weighted sound pressure level, we need to include the weighting factors of each band.
The A-weighting is defined as having 0dB of correction at 1000Hz. When we specify that a decibel figure has been A-weighted, it is denoted as dB(A).
Sound Sources and Sound Power
The next step is to understand exactly where a sound comes from – the sound source. This is defined as the object where the sound is actually generated, not where it might be amplified or attenuated. The sound source creates vibrations, pushing outwards at the speed of sound, forming the sound wave. In HVAC systems, common sound sources are the fan or a damper.
The sound power generated at a sound source is different from the sound pressure we measure. When we measure the sound pressure in a space, all sorts of other factors come into play: the sound absorption of the room, the size of the space, any background noise and so on. So we use a different measure to define the sound energy coming only from the sound source: Sound Power.
The formula for defining Sound Power is:
Lw = 10 log (W/W0) = 10 log (W/10-12)
Where Lw is the Sound Power level in dB, W is the Sound power in Watts, and W0 is the reference value (see below).
As when we measure sound pressure, we use a reference value when defining the sound power, and that is 10-12 W. As with sound pressure, sound power can be defined for each octave band, with the sum of these called the Total Sound Power Level. If the A-weighting filter is used, we obtain the total A-weighted Sound Power Level in the same way.
Adding Sound Sources
If there are more than one sound source, defining their combined sound level is not as simple as adding the two dB figures together. In essence, if one sound source is much stronger than the other, the additional sound level created by the two will not be much (if any) more than that created by the stronger sound source.
Only when the difference between the two sound sources is small will there be an increase in sound level; if the difference is more than 10dB, then the increase is very small increase when compared to the stronger sound source.
If you think about it, if you are in a room with loud music playing, someone talking at normal volume will not increase the overall level of noise in the room. But two or more people speaking at normal volume will sound louder than just one person.
The actual formula for calculating the combined sound level of two sound sources is:
Lp = 10 log (10 x Lp1/10 + 10 x Lp2/10 )
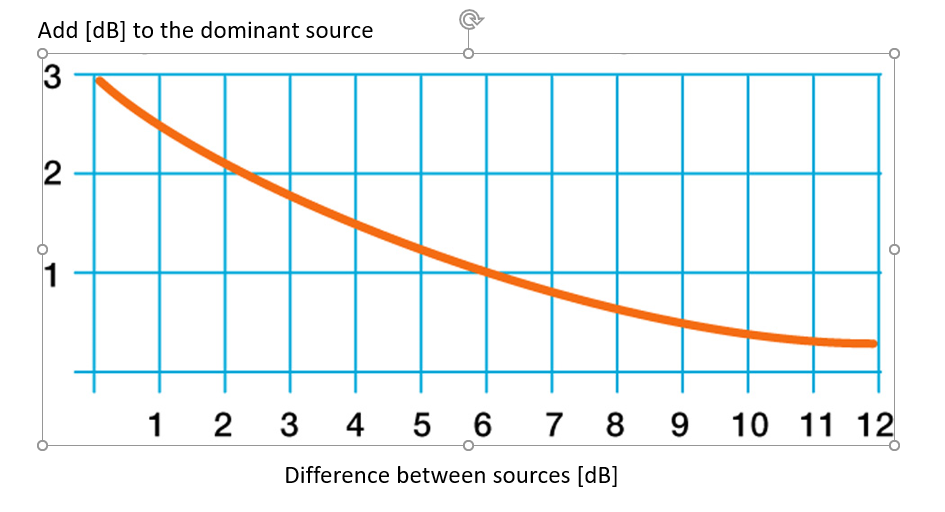
There is a useful graph to show the extent to which a second sound source will increase the overall sound level (or not), which is shown in Fig. 2.

Here you can see, for example, that if there are two sound sources, one at 80dB and one at 86dB, the combined sound level will be 87dB – because the difference of 6dB between the two sources adds just 1dB to the combined level.
Here to help
If you'd like to know more or need help choosing one of our products please don't hesitate to get in touch. Our friendly experts will be happy to advise you.
2024-06-06